SenseMaker Project: Mini Grants
September 2020 – Present
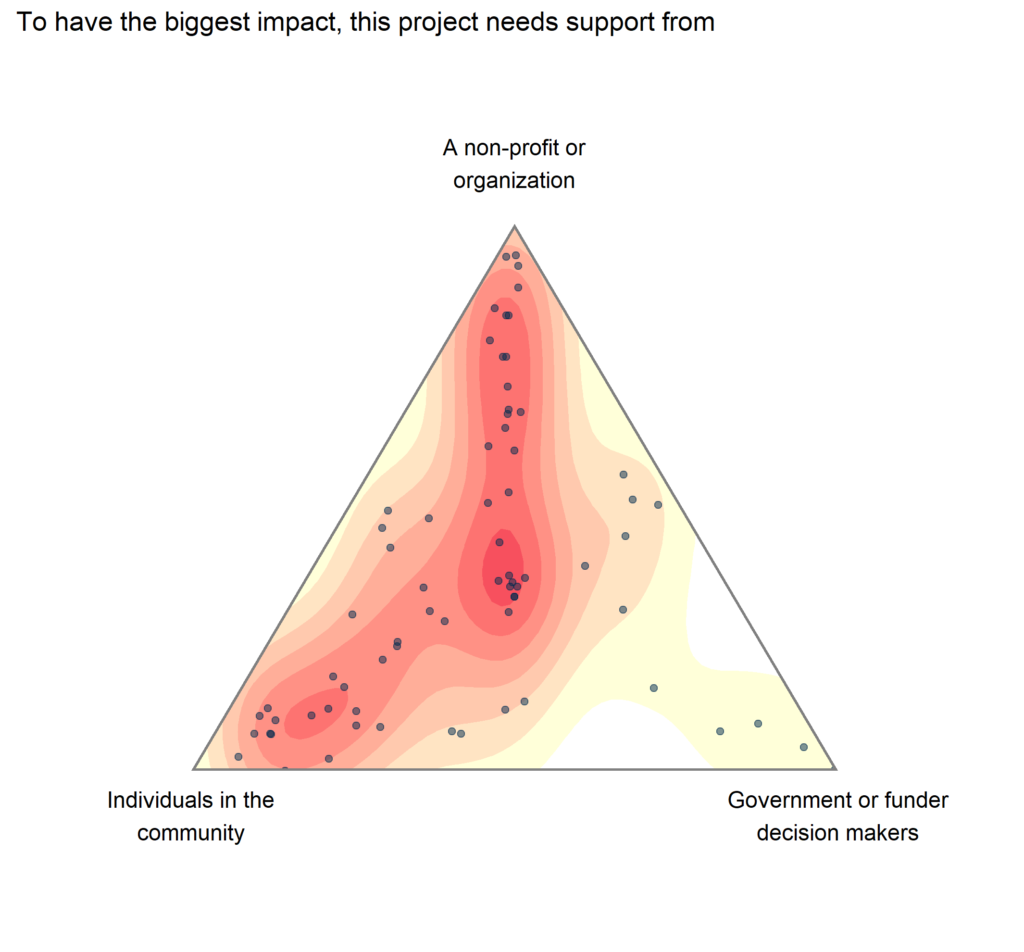
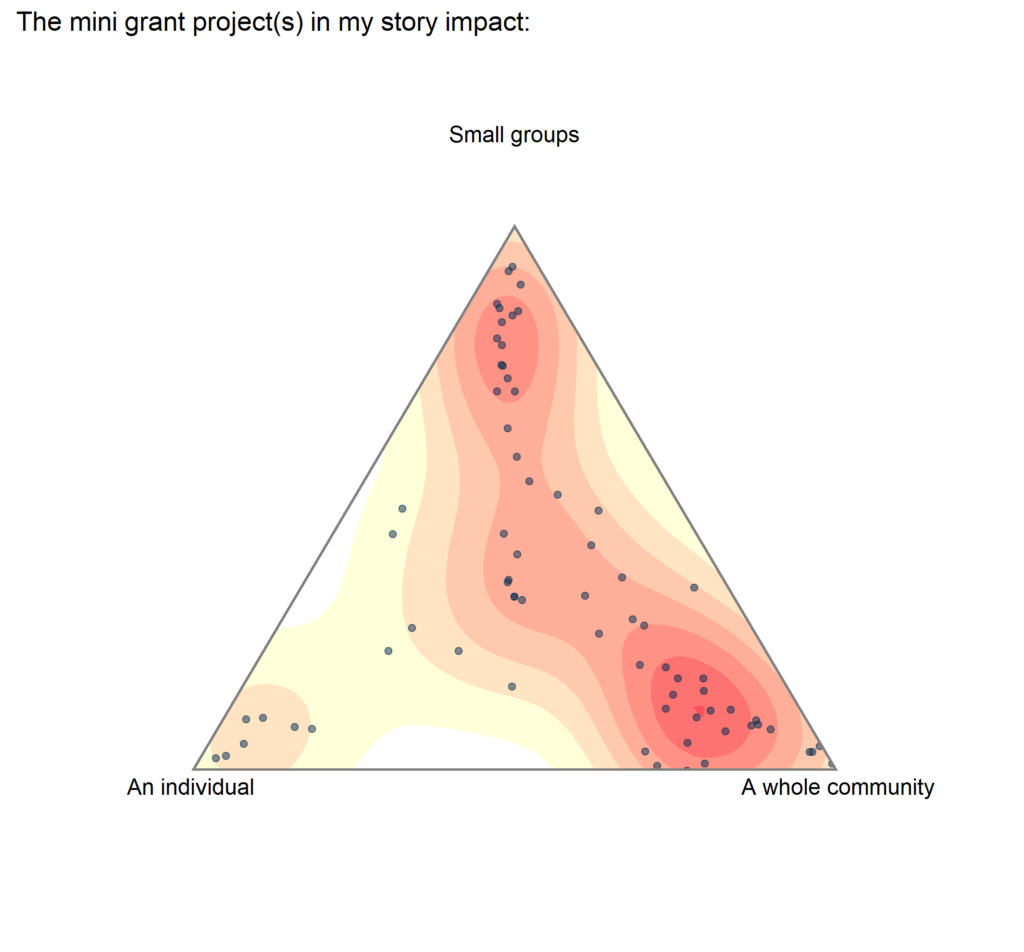
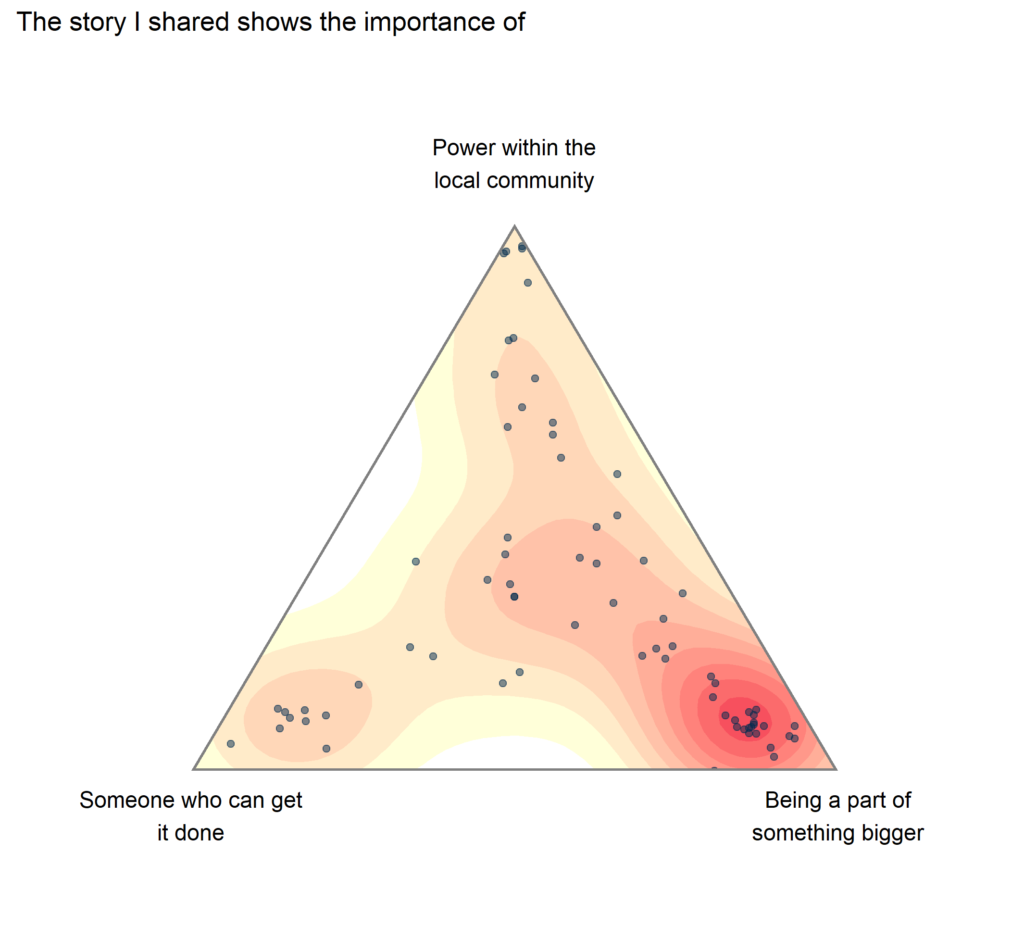
Below are visuals showing how community members interpreted their narrative about the mini grants in which they’ve been involved. If you’d like to read the narratives describing their experiences with mini grants, please visit the Mini Grant project page.
New to these data visuals? View the Quick Guide for Interpreting Data Visuals. Wondering what to make of them? Check out Exploring the Visuals: What to Look For.


Impact on the Community