SenseMaker Project: NOW
July 2020 – November 2020
Learn more about who shared a story or enter the story collection.
New to these data visuals? View the Quick Guide for Interpreting Data Visuals. Wondering what to make of them? Check out Exploring the Visuals: What to Look For.
Emotional Tone
Storytellers were asked, “How do you feel about your story?” They had five options ranging from “strongly negative” to “strongly positive.” The visual below shows how many stories were in each category.

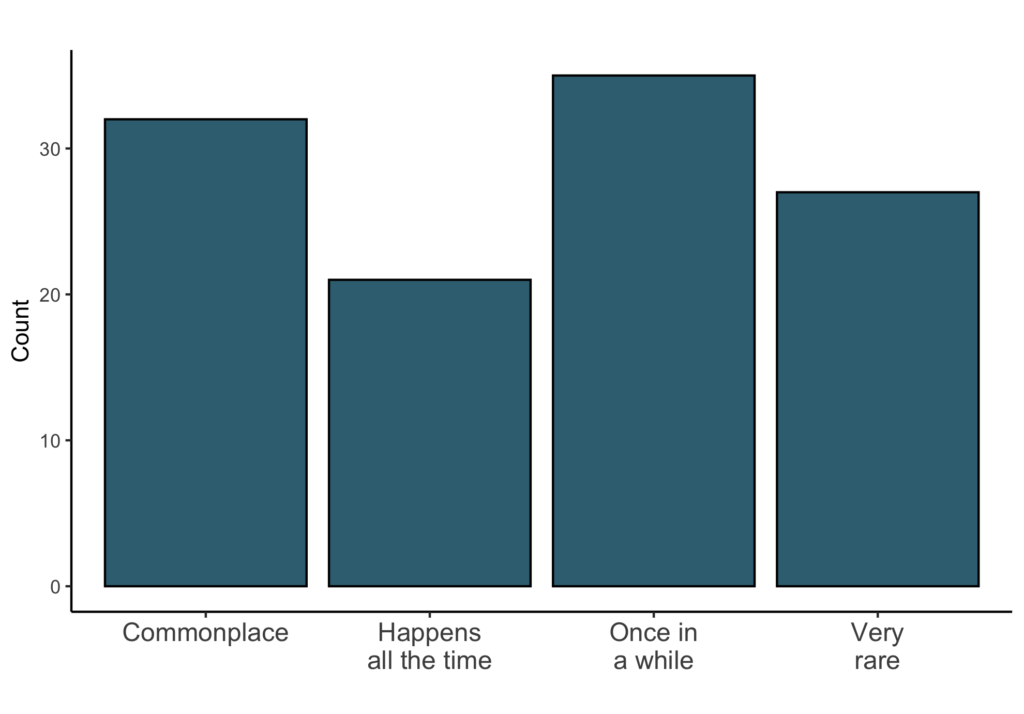
How Common Were the Stories?
Solutions and Resilience

The visual above is separated into two based on whether the stories were positive (“Strongly positive” or “Positive) or negative (“Strongly negative” or “Negative”).


Change and the Impact on the Community
Acceptance or Change
What I shared shows my community will:


Who is impacted?
What I shared has the potential to impact:


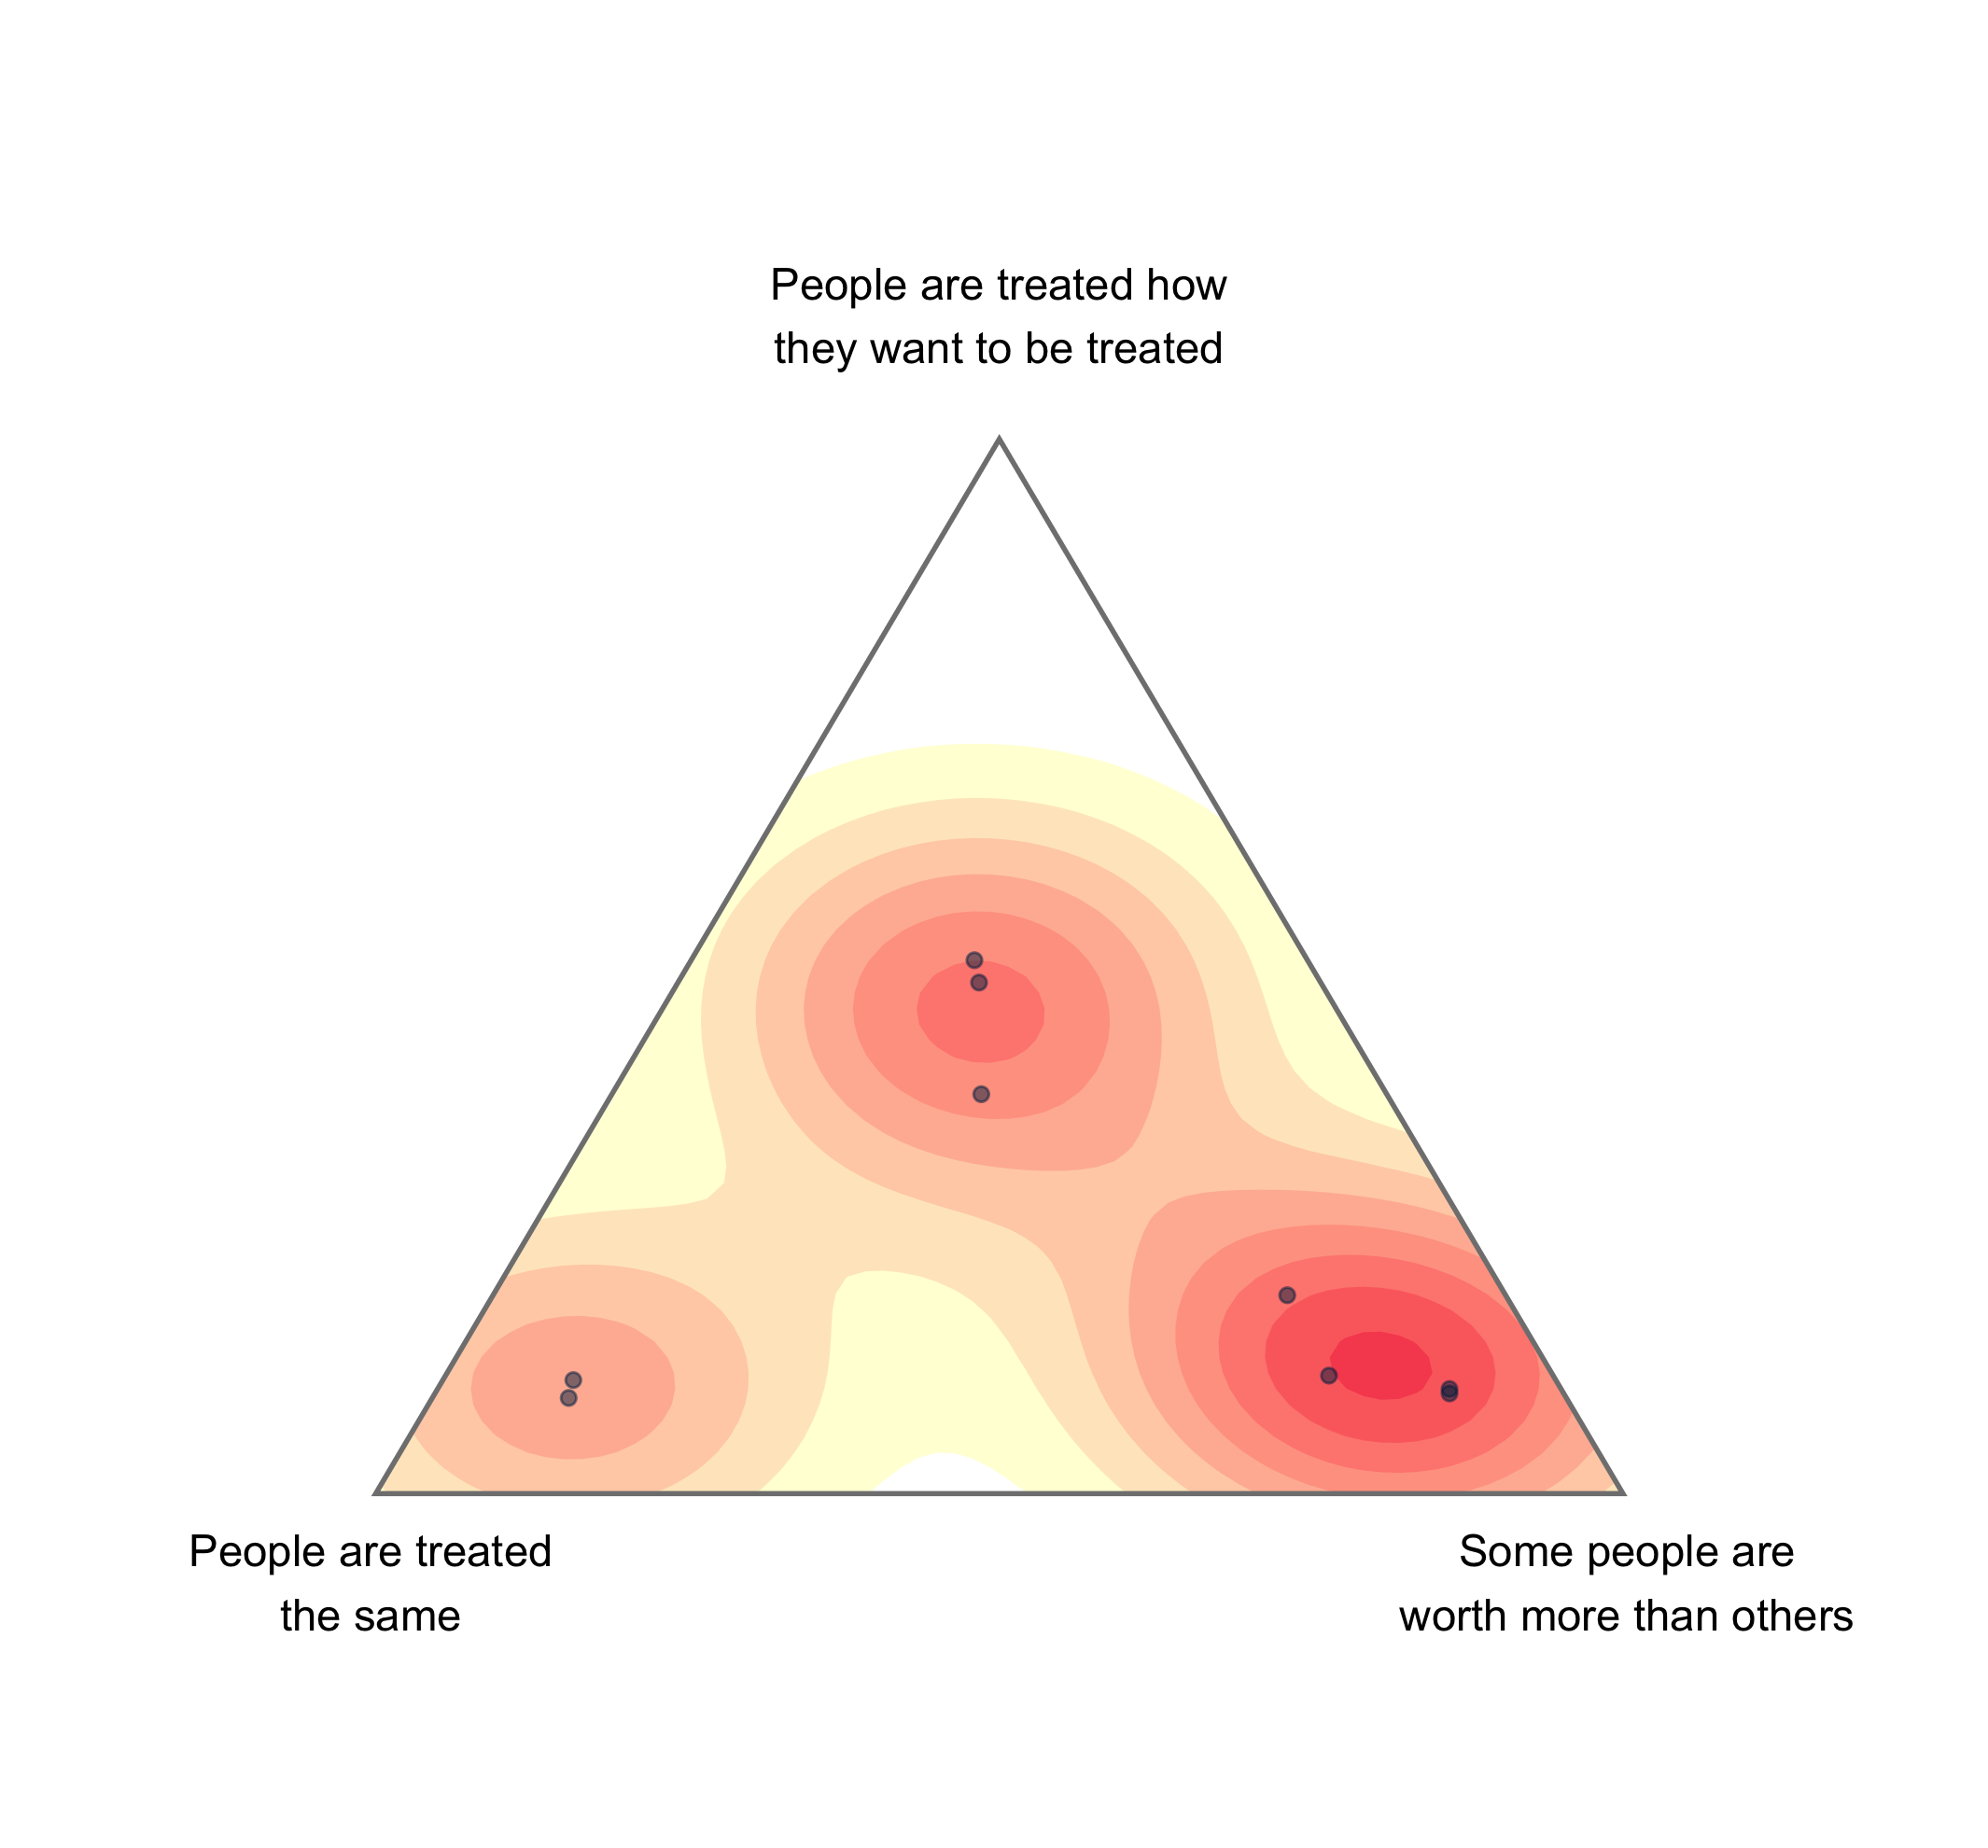
How People are Treated
What I shared shows: