Mayor’s Village Initiative Area
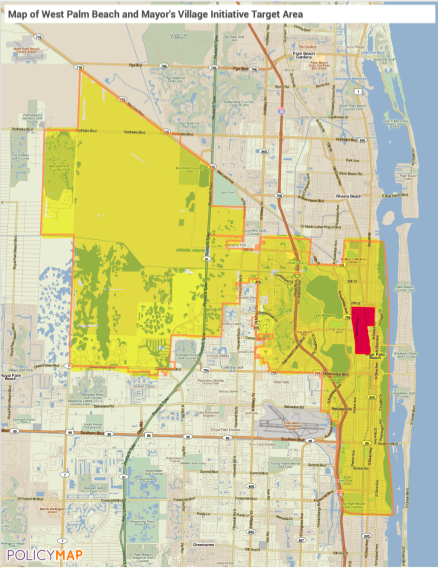
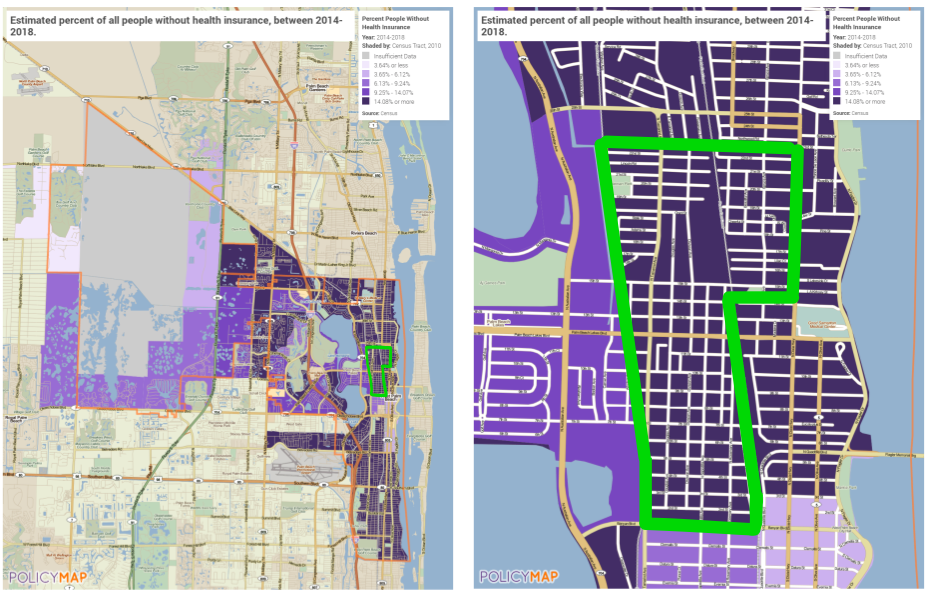
The Mayor’s Village Initiative (MVI) serves North Tamarind, Pleasant City, and Progressive Northwest in West Palm Beach, FL. The MVI target area consists of three census tracts (areas), which are part of West Palm Beach’s 27 tracts. Figures show information for the MVI target area (shown in pink below) and the rest of West Palm Beach (shown in yellow below).
Health Equity
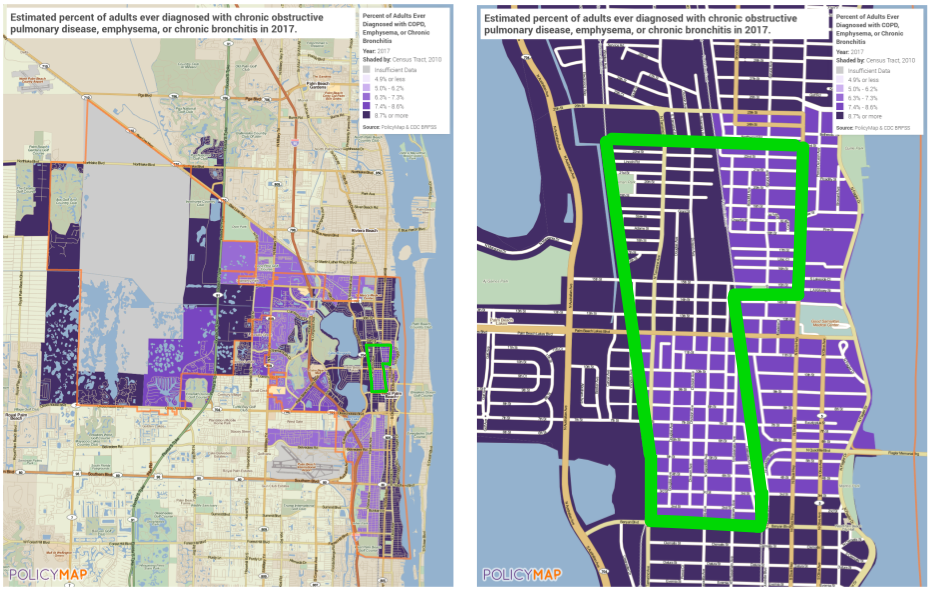
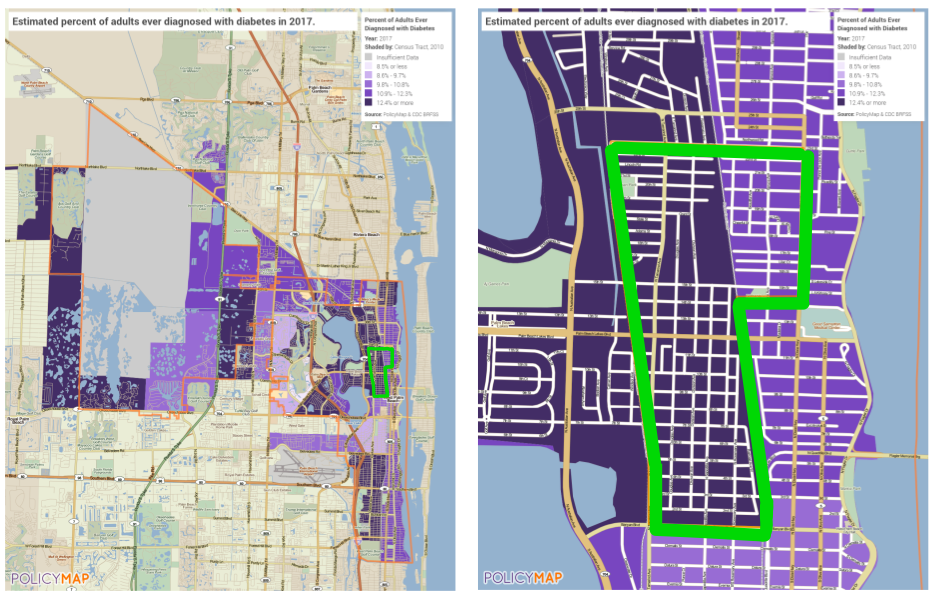
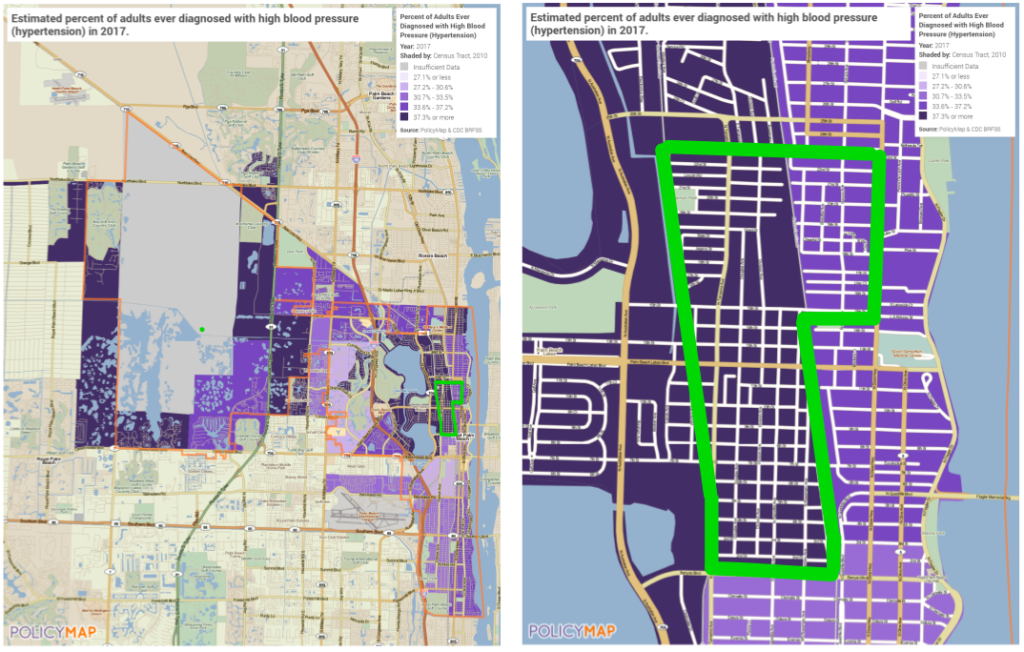
The following maps show information about underlying health conditions and health insurance coverage. The more prevalent the health condition is among the population, the darker the purple. The more prevalent the lack of health insurance is among the population, the darker the purple.

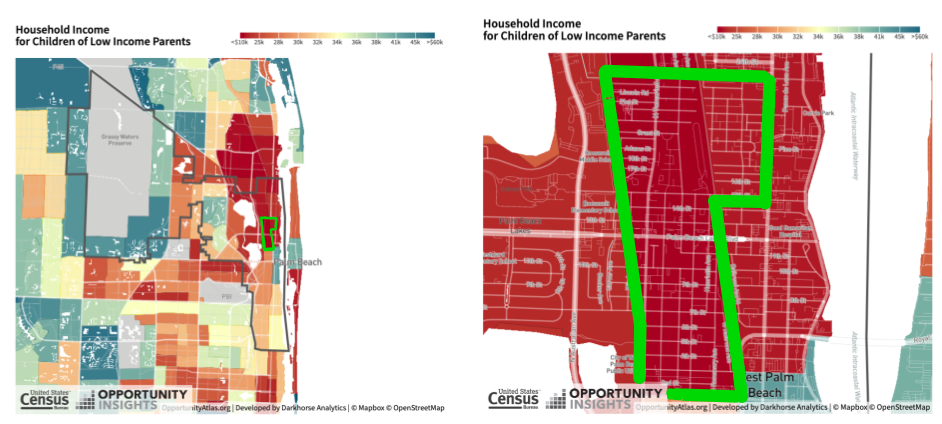
Economic Mobility
The following maps show incarceration rates for all people who grew up in the area and the household income of people who grew up in the area with low-income parents. A high incarceration rate (shown in orange/red) indicates low economic mobility, as formerly incarcerated people experience less upward economic mobility than people who were never incarcerated. A low household income (shown in red/orange) would indicate low economic mobility, as children’s incomes did not increase compared to their low-income parents.

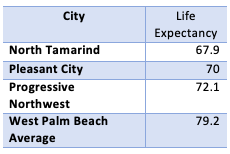
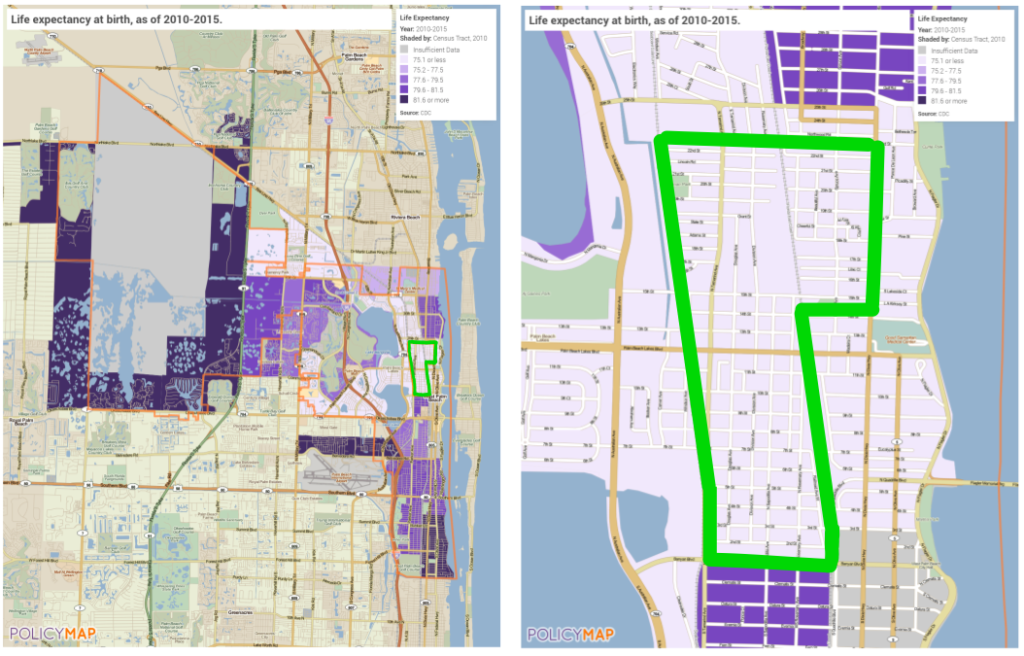
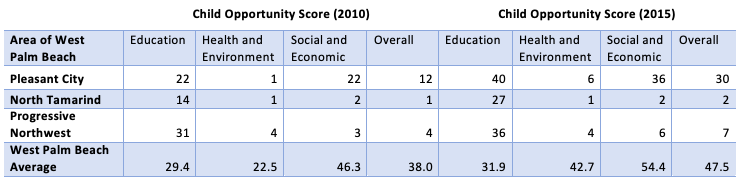
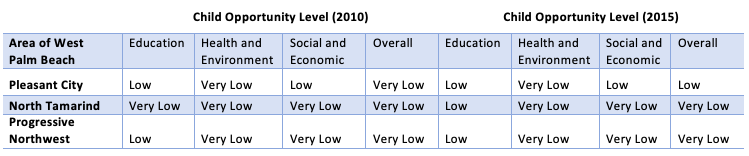
Child Opportunity
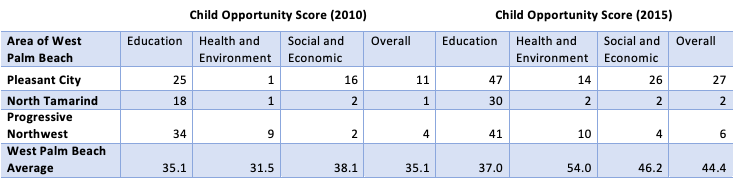
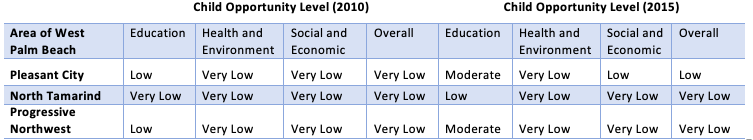
Life expectancy at birth is shown in the first table below. Additionally, the Children’s Opportunity Index (COI) gives quintile levels and 1-100 scores for overall child opportunity and areas like education, health and environment, and social-economic. The quintiles ae measured as very low (lowest 20%), low (20-40%), moderate (40-60%), high (60-80%), and very high (top 80-100%). This information was recorded in 2010 and 2015. The West Palm Beach average metric was calculated as the average of all of the tracts in West Palm Beach except for the target area. This was done so one can compare the target area to the rest of West Palm Beach.
National context:
| Area of West Palm Beach | Education | Health and Environment | Social and Economic | Overall |
| Pleasant City | 25 | 1 | 16 | 11 |
| North Tamarind | 18 | 1 | 2 | 1 |
| Progressive Northwest | 34 | 9 | 2 | 4 |
| West Palm Beach Average | 35.1 | 31.5 | 38.1 | 35.1 |
| Area of West Palm Beach | Education | Health and Environment | Social and Economic | Overall |
| Pleasant City | Low | Very Low | Very Low | Very Low |
| North Tamarind | Very Low | Very Low | Very Low | Very Low |
| Progressive Northwest | Low | Very Low | Very Low | Very Low |
| Area of West Palm Beach | Education | Health and Environment | Social and Economic | Overall |
| Pleasant City | 47 | 14 | 26 | 27 |
| North Tamarind | 30 | 2 | 2 | 2 |
| Progressive Northwest | 41 | 10 | 4 | 6 |
| West Palm Beach Average | 37.0 | 54.0 | 46.2 | 44.4 |
| Area of West Palm Beach | Education | Health and Environment | Social and Economic | Overall |
| Pleasant City | Moderate | Very Low | Low | Low |
| North Tamarind | Low | Very Low | Very Low | Very Low |
| Progressive Northwest | Moderate | Very Low | Very Low | Very Low |
State context:
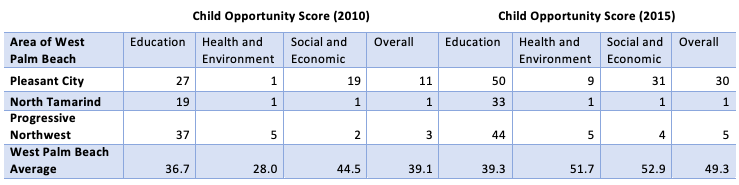
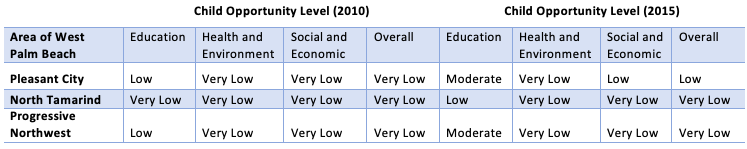
Metro context:
References
National Center for Health Statistics. U.S. Small-Area Life Expectancy Estimates Project (USALEEP): Life Expectancy Estimates File for {Jurisdiction}, 2010-2015]. National Center for Health Statistics. 2018. Available from: https://www.cdc.gov/nchs/nvss/usaleep/usaleep.html.
Noelke, C., McArdle, N., Baek, M., Huntington, N., Huber, R., Hardy, E., & Acevedo-Garcia, D. (2020).
Child Opportunity Index 2.0 Technical Documentation. Retrieved from diversitydatakids.org/researchlibrary/research-brief/how-we-built-it..
The Pew Charitable Trusts, 2010. Collateral Costs: Incarceration’s Effect on Economic
Mobility. Washington, DC: The Pew Charitable Trusts.
Source: www.policymap.com
Raj Chetty & John N. Friedman & Nathaniel Hendren & Maggie R. Jones & Sonya R. Porter, 2018. “The Opportunity Atlas: Mapping the Childhood Roots of Social Mobility,” Working Papers 18-42, Center for Economic Studies, U.S. Census Bureau.