Read first: Quick Guide: Interpreting the Data Visuals
As you explore the data visuals, what patterns do you notice? Do the patterns fit your expectations? Or do you see patterns you did not expect?
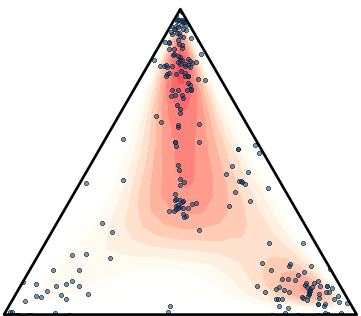
In addition to noticing the big trends, look for small groups of responses separate from the rest. These small clusters might show what is possible for the community, for better or worse. They can also lead to unexpected insights.
After you view the visuals, you can search for stories based on how residents responded to the question. For example, a small group of storytellers shared that their story shows we need to “think about what went wrong.” You can perform a search (using the search and filter page) and find the stories that were interpreted in this way. What happens in these stories? What are the stories about?